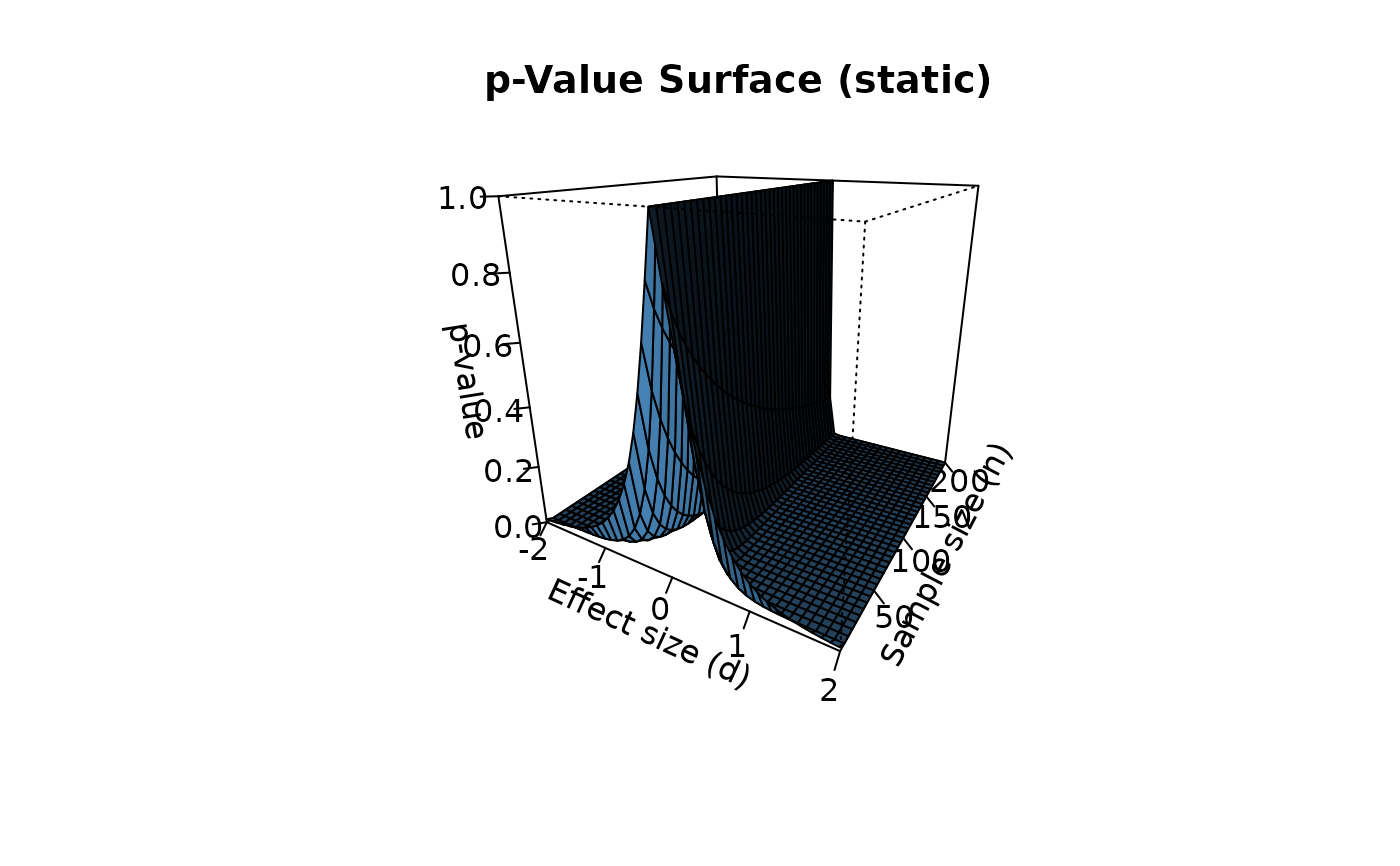
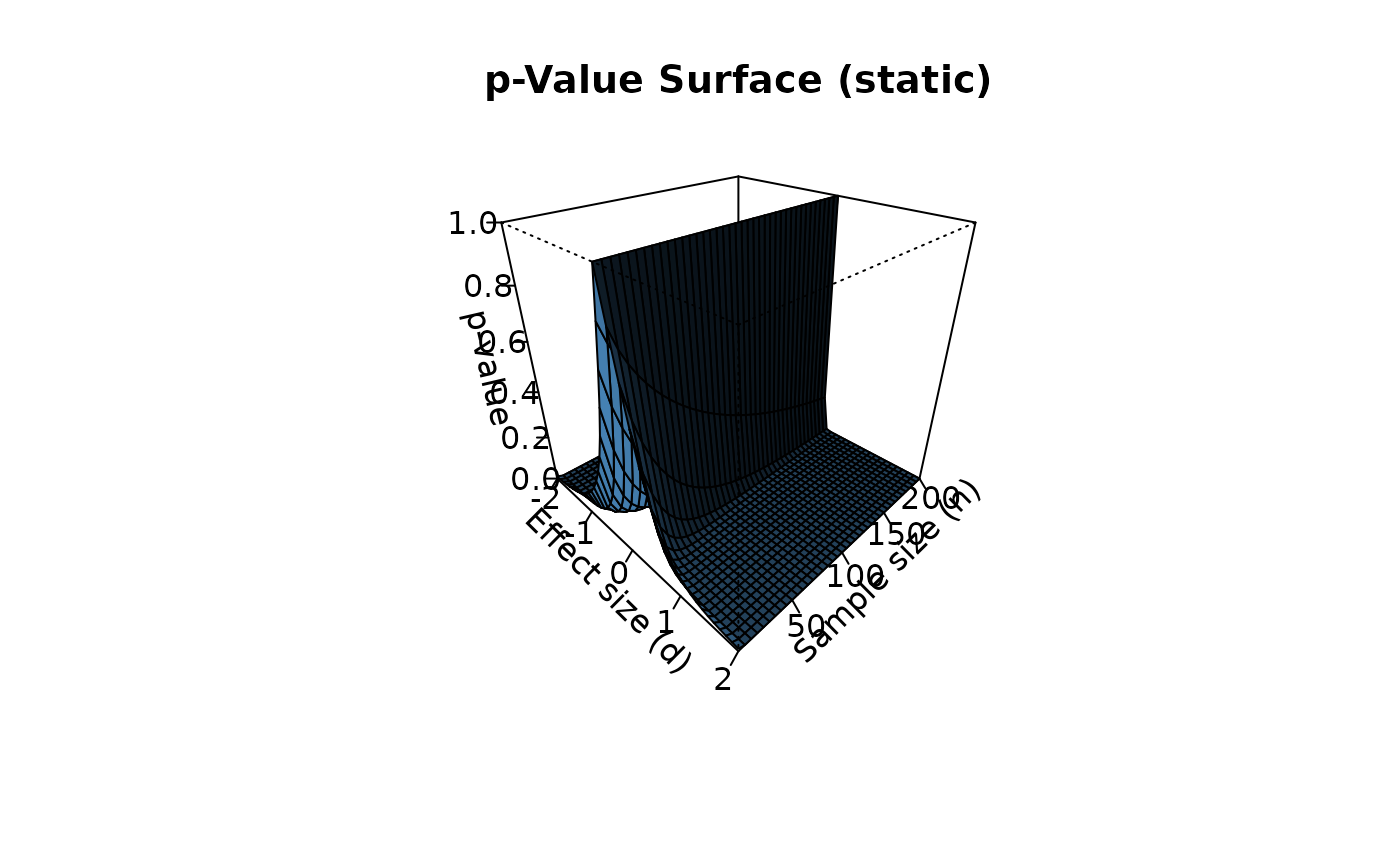
Plots the output of p_surface using base R's
persp function. This produces a static
3D perspective plot with no external dependencies, making it
suitable for PDF output, journal figures, and CRAN checks.
Arguments
- surface
A list returned by
p_surface.- theta, phi
Viewing angles in degrees. See
perspfor details. Defaults:theta = 30,phi = 20.- col
Color palette for the surface. Either a single color or a vector of colors matching the number of \(d \times n\) grid cells.
- shade
Logical; if
TRUE(default), the surface is shaded usingpersp's shading.- alpha
Significance level. A horizontal plane at \(p = \alpha\) is overlaid on the surface. Default: 0.05.
Details
Unlike plot_p_surface, which requires
rgl or plotly, this function uses only base R
graphics. It is ideal for inclusion in static documents
such as PDF articles and printed reports.